The Golem Project
Hod Lipson and Jordan B. Pollack
|
|
|
|
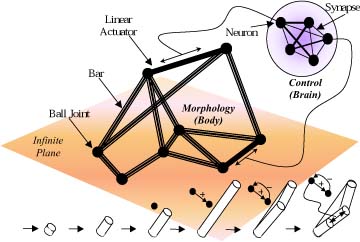
Our approach is based on the use of evolutionary computation for design, and additive fabrication for reproduction. The evolutionary process operates on a population of candidate robots, each composed of some repertoire of building blocks. The evolutionary process iteratively selects fitter machines, creates offspring by adding, modifying and removing building blocks using a set of operators, and replaces them into the population. Initially all robots in the population are empty - they contain zero bars, actuators and neurons. The choice of building blocks and operators we make available for the evolutionary process is critical. As building blocks are more elementary, the architectural flexibility in both the design and fabrication is maximized, while our own human intervention - our inductive bias - is minimized.
| The design space we used was comprised of bars and actuators as building blocks of structure and artificial neurons as building blocks of control. Bars connected with free joints can potentially form trusses that represent arbitrary rigid, flexible and articulated structures as well as multiple detached structures, and emulate revolute, linear and planar joints at various levels of hierarchy. Similarly, sigmoidal neurons can connect to create arbitrary control architectures such as feed-forward and recurrent nets, state machines and multiple independent controllers (like multiple ganglia). |
 |
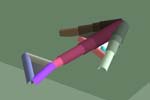
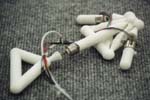
Starting with a population of 200 machines that were comprised initially of zero bars and zero neurons, we conducted evolution in simulation. The fitness of a machine was determined by its locomotion ability: the net distance its center of mass moved on an infinite plane in a fixed duration. The process iteratively selected fitter machines, created offspring by adding, modifying and removing building blocks, and replaced them into the population (see methods section). This process typically continued for 300 to 600 generations. Both body (morphology) and brain (control) were thus co-evolved simultaneously. The simulator we used for evaluating fitness supported quasi-static motion in which each frame is statically stable. This kind of motion is simpler to transfer reliably into reality, yet is rich enough to support low-momentum locomotion. Typically, several tens of generations passed before the first movement occurred. For example, at a minimum, a neural network generating varying output must assemble and connect to an actuator for any motion at all (see sequence in the figure above for an example).
A typical evolution process looks like this: Video [2MB]
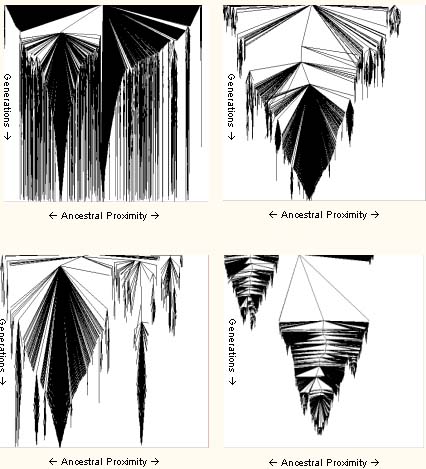
| Various patterns of evolutionary dynamics emerged, some of which are reminiscent of natural phylogenic trees. Some examples of extreme cases of convergence, speciation, and massive extinction are shown here. Each node in the tree represents an individual and links represent parent-child relationship. Vertical axis represents generations and horizontal axis represents ancestral proximity in terms of hops along the tree necessary to get from one individual to another. All trees originate at a common root denoting an empty robot with zero bars and actuators. Extreme divergence results from niching methods; extreme convergence, resulted from fitness-proportionate selection; intermediate level of divergence is typical of earlier stages of fitness-proportionate selection and bottom right sows a case of massive extinction under fitness proportionate selection. The trees were thinned and depict several hundred generations each. |
 |
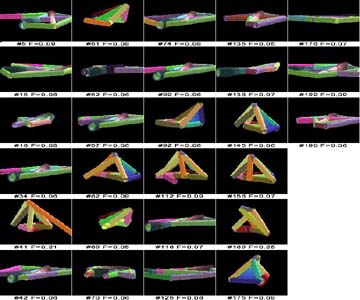
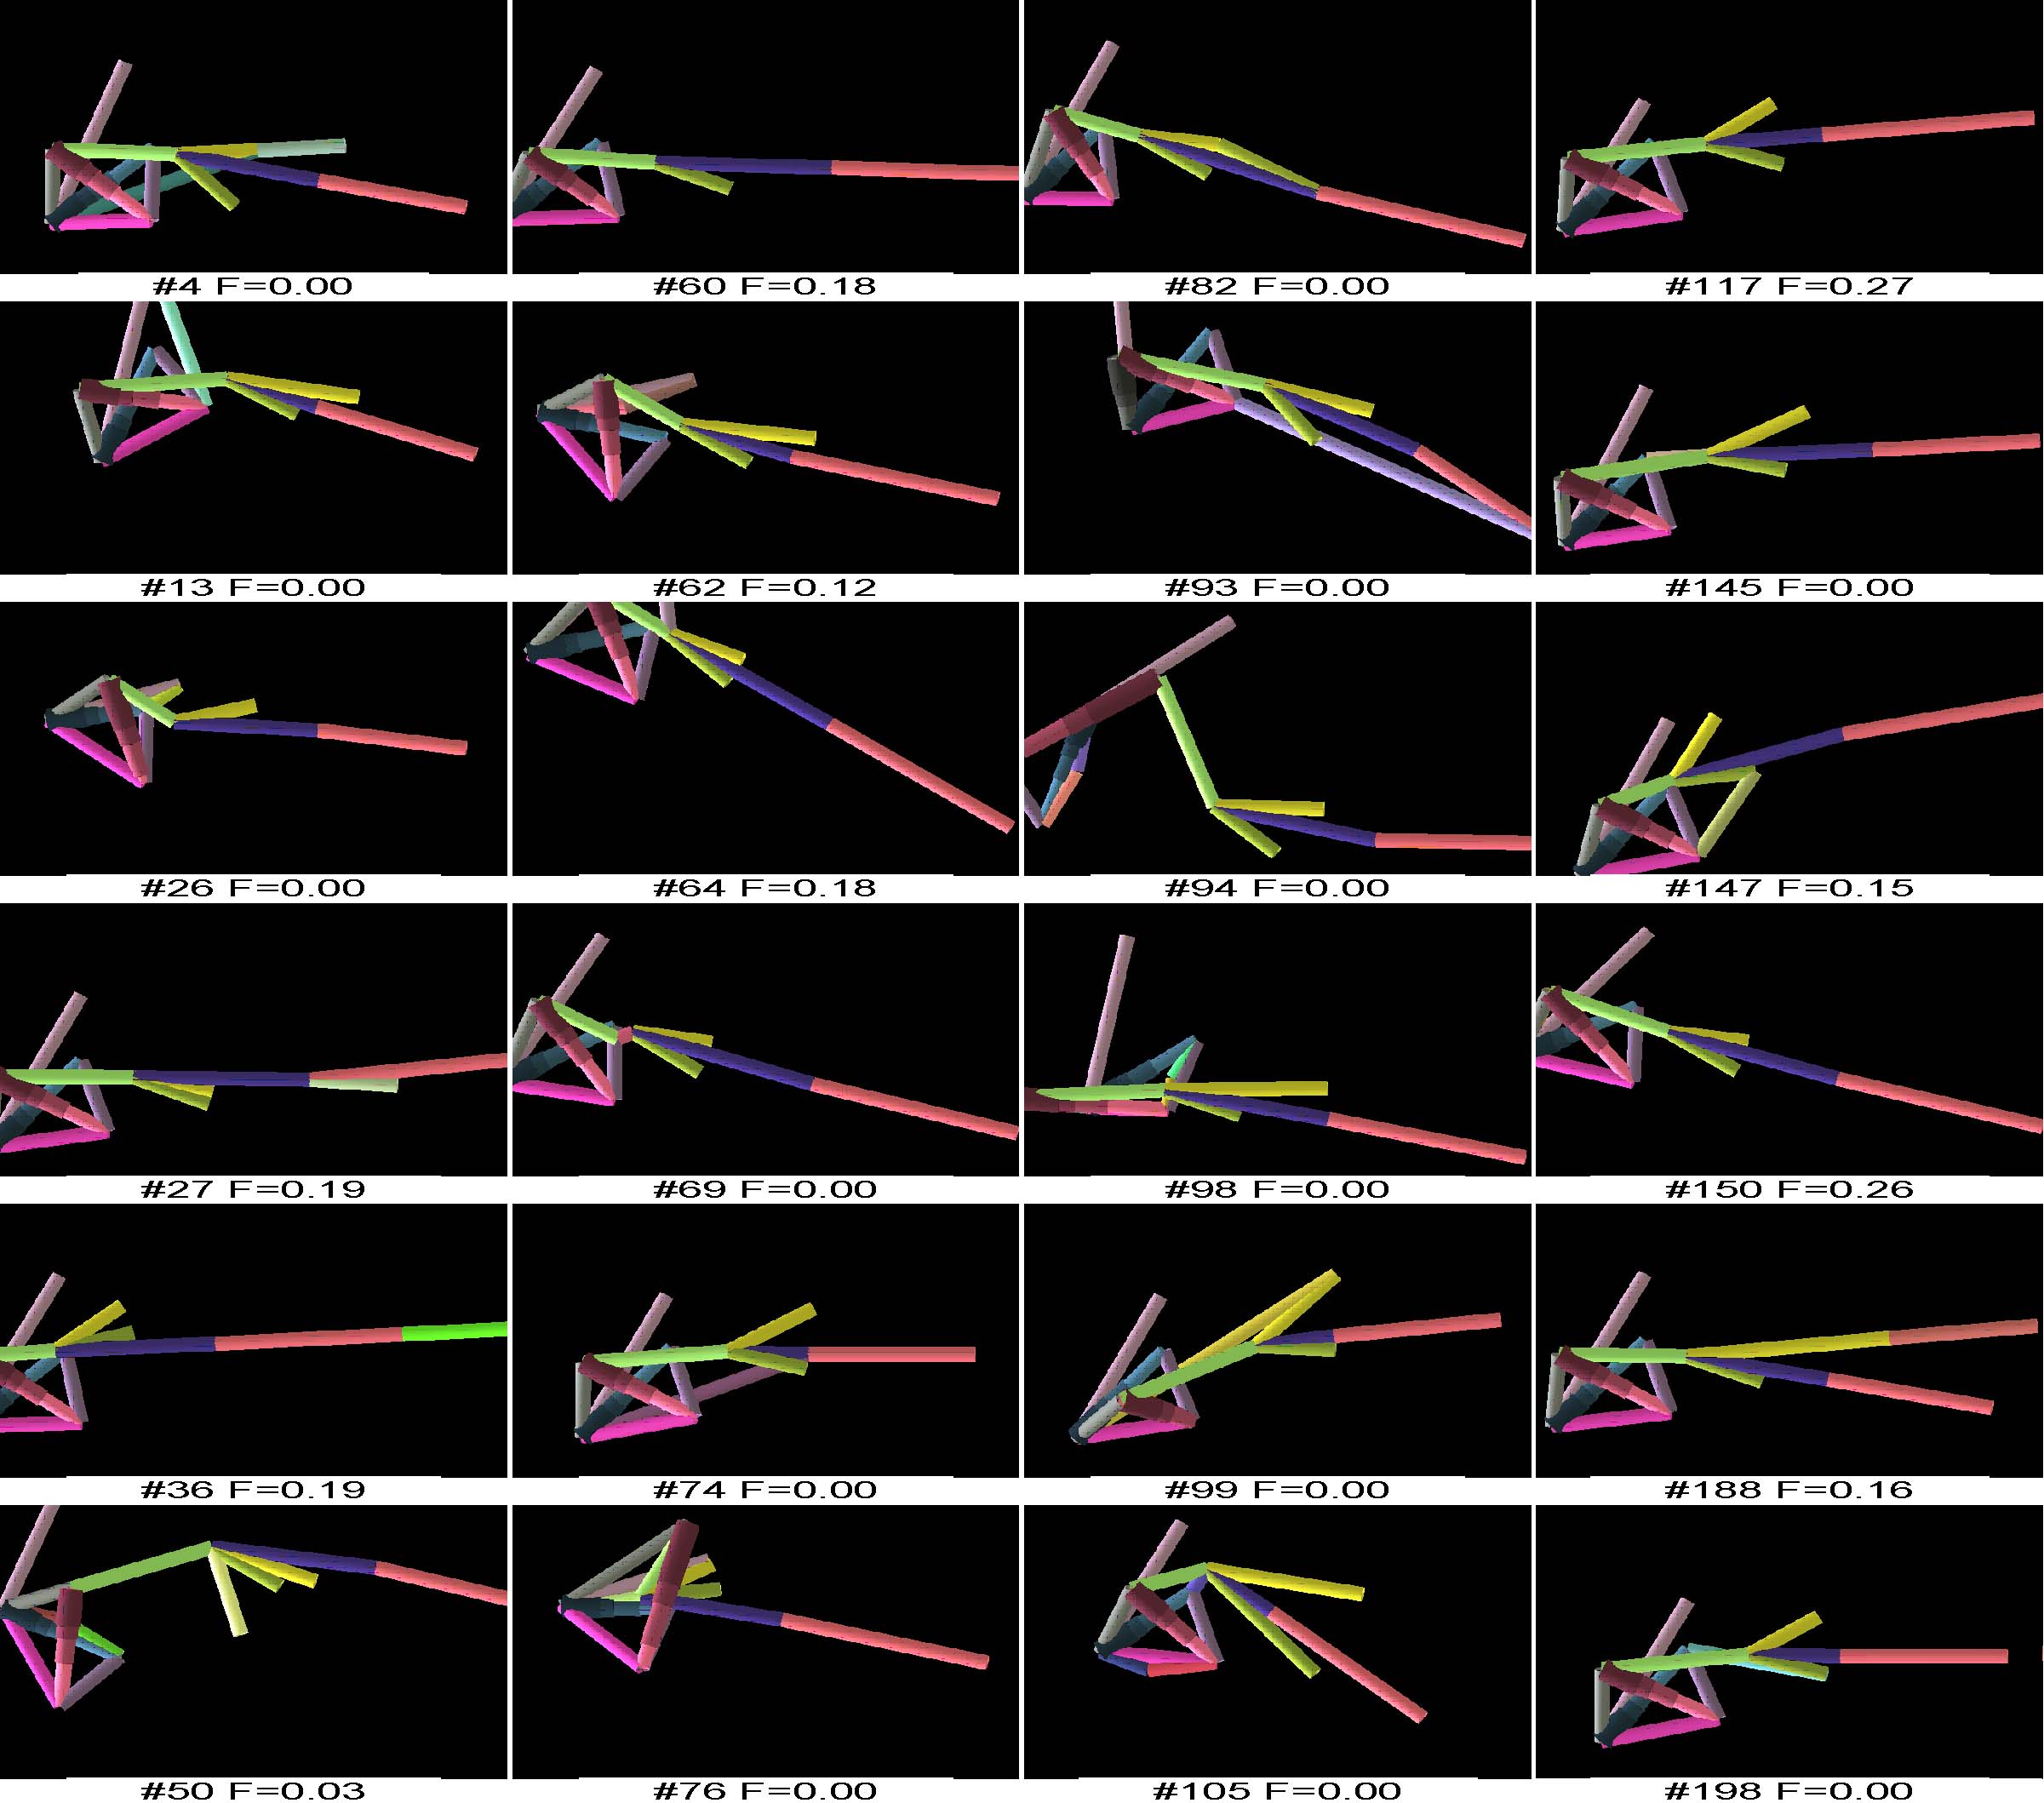
Two arbitrarily sampled instances of entire generations, thinned down to show only significantly different individuals, are shown below. The caption under each image provides an arbitrary index (used for reference) and the fitness of that individual. On the left, two subpopulations of robots are observable, each with its own variations: one flat on the ground, and the other containing some elevated structure. The population on the right seems converged; all individuals have similar morphologies.
 |
 |
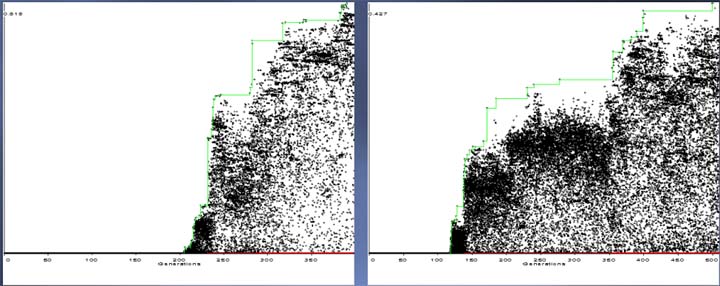
The graphs below show how fitness of creatures progresses over the generations. The horizontal axis counts generations, and the vertical axis measures fitness (locomotion distance, in this case). Each dot is an individual being born. Note two interesting aspects: first, progress is made in noticeable jumps. Second, progress rate becomes slower as the fitness becomes higher.
See some of the results.
|
Copyright (c) 2000 Lipson & Pollack |
lipson@cs.brandeis.edu |
Updated |